Benchmarks — MLGWSC-1 Results
All results below are evaluated on the D4 testing dataset from the Machine Learning Gravitational-Wave Search Challenge (Schäfer et al. 2023, arXiv:2209.11146), which provides standardised noise and injection sets for direct comparison between pipelines.
Sensitive distance vs. false alarm rate
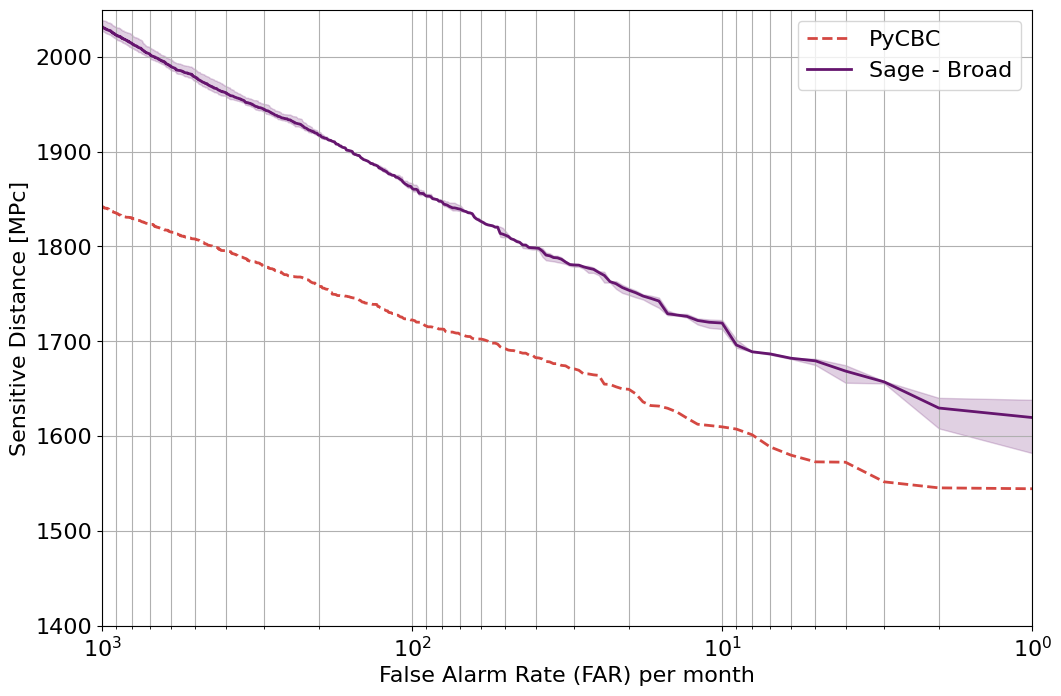
Sensitive distance as a function of FAR for PyCBC and the Sage — Broad run. The solid violet line is the mean sensitive distance over 3 independent runs with the Broad configuration; error bars indicate the min/max range across those runs.
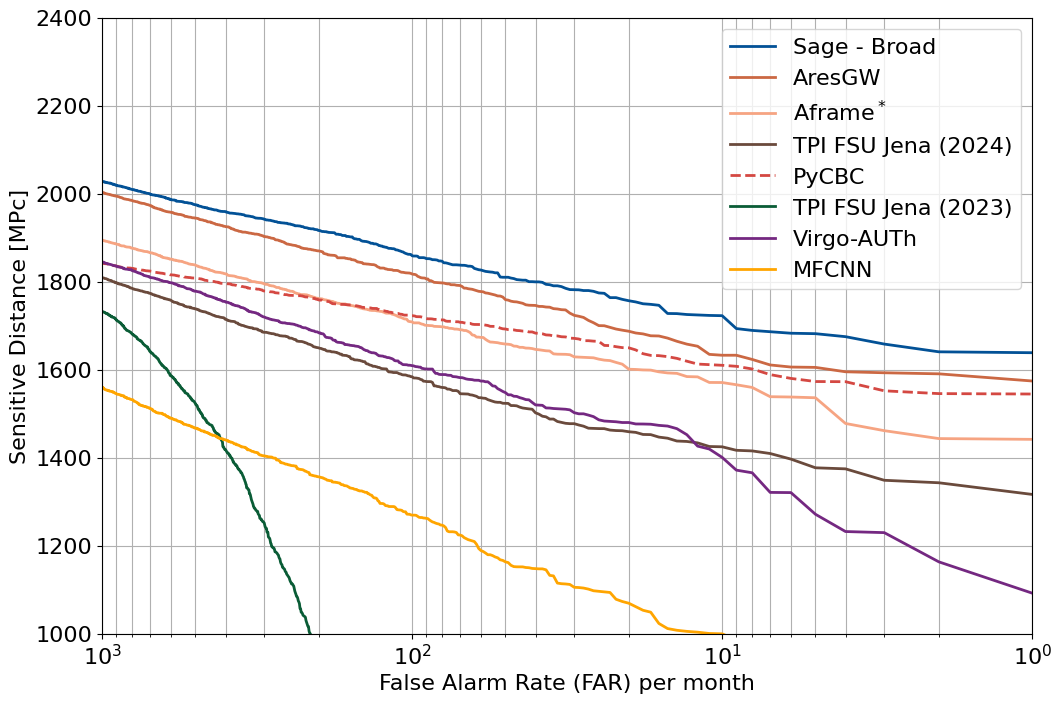
Sensitive distance as a function of FAR per month for Sage — Broad, other ML pipelines, and PyCBC on the D4 testing dataset. AresGW results from Nousi et al. (2023) (arXiv:2211.01520); Aframe and TPI FSU Jena (2024) results via private communication; all other results from Schäfer et al. (2023). Aframe results are marked with an asterisk (✱) as their pipeline is not optimised for the D4 mass distribution in MLGWSC-1.
ROC curves
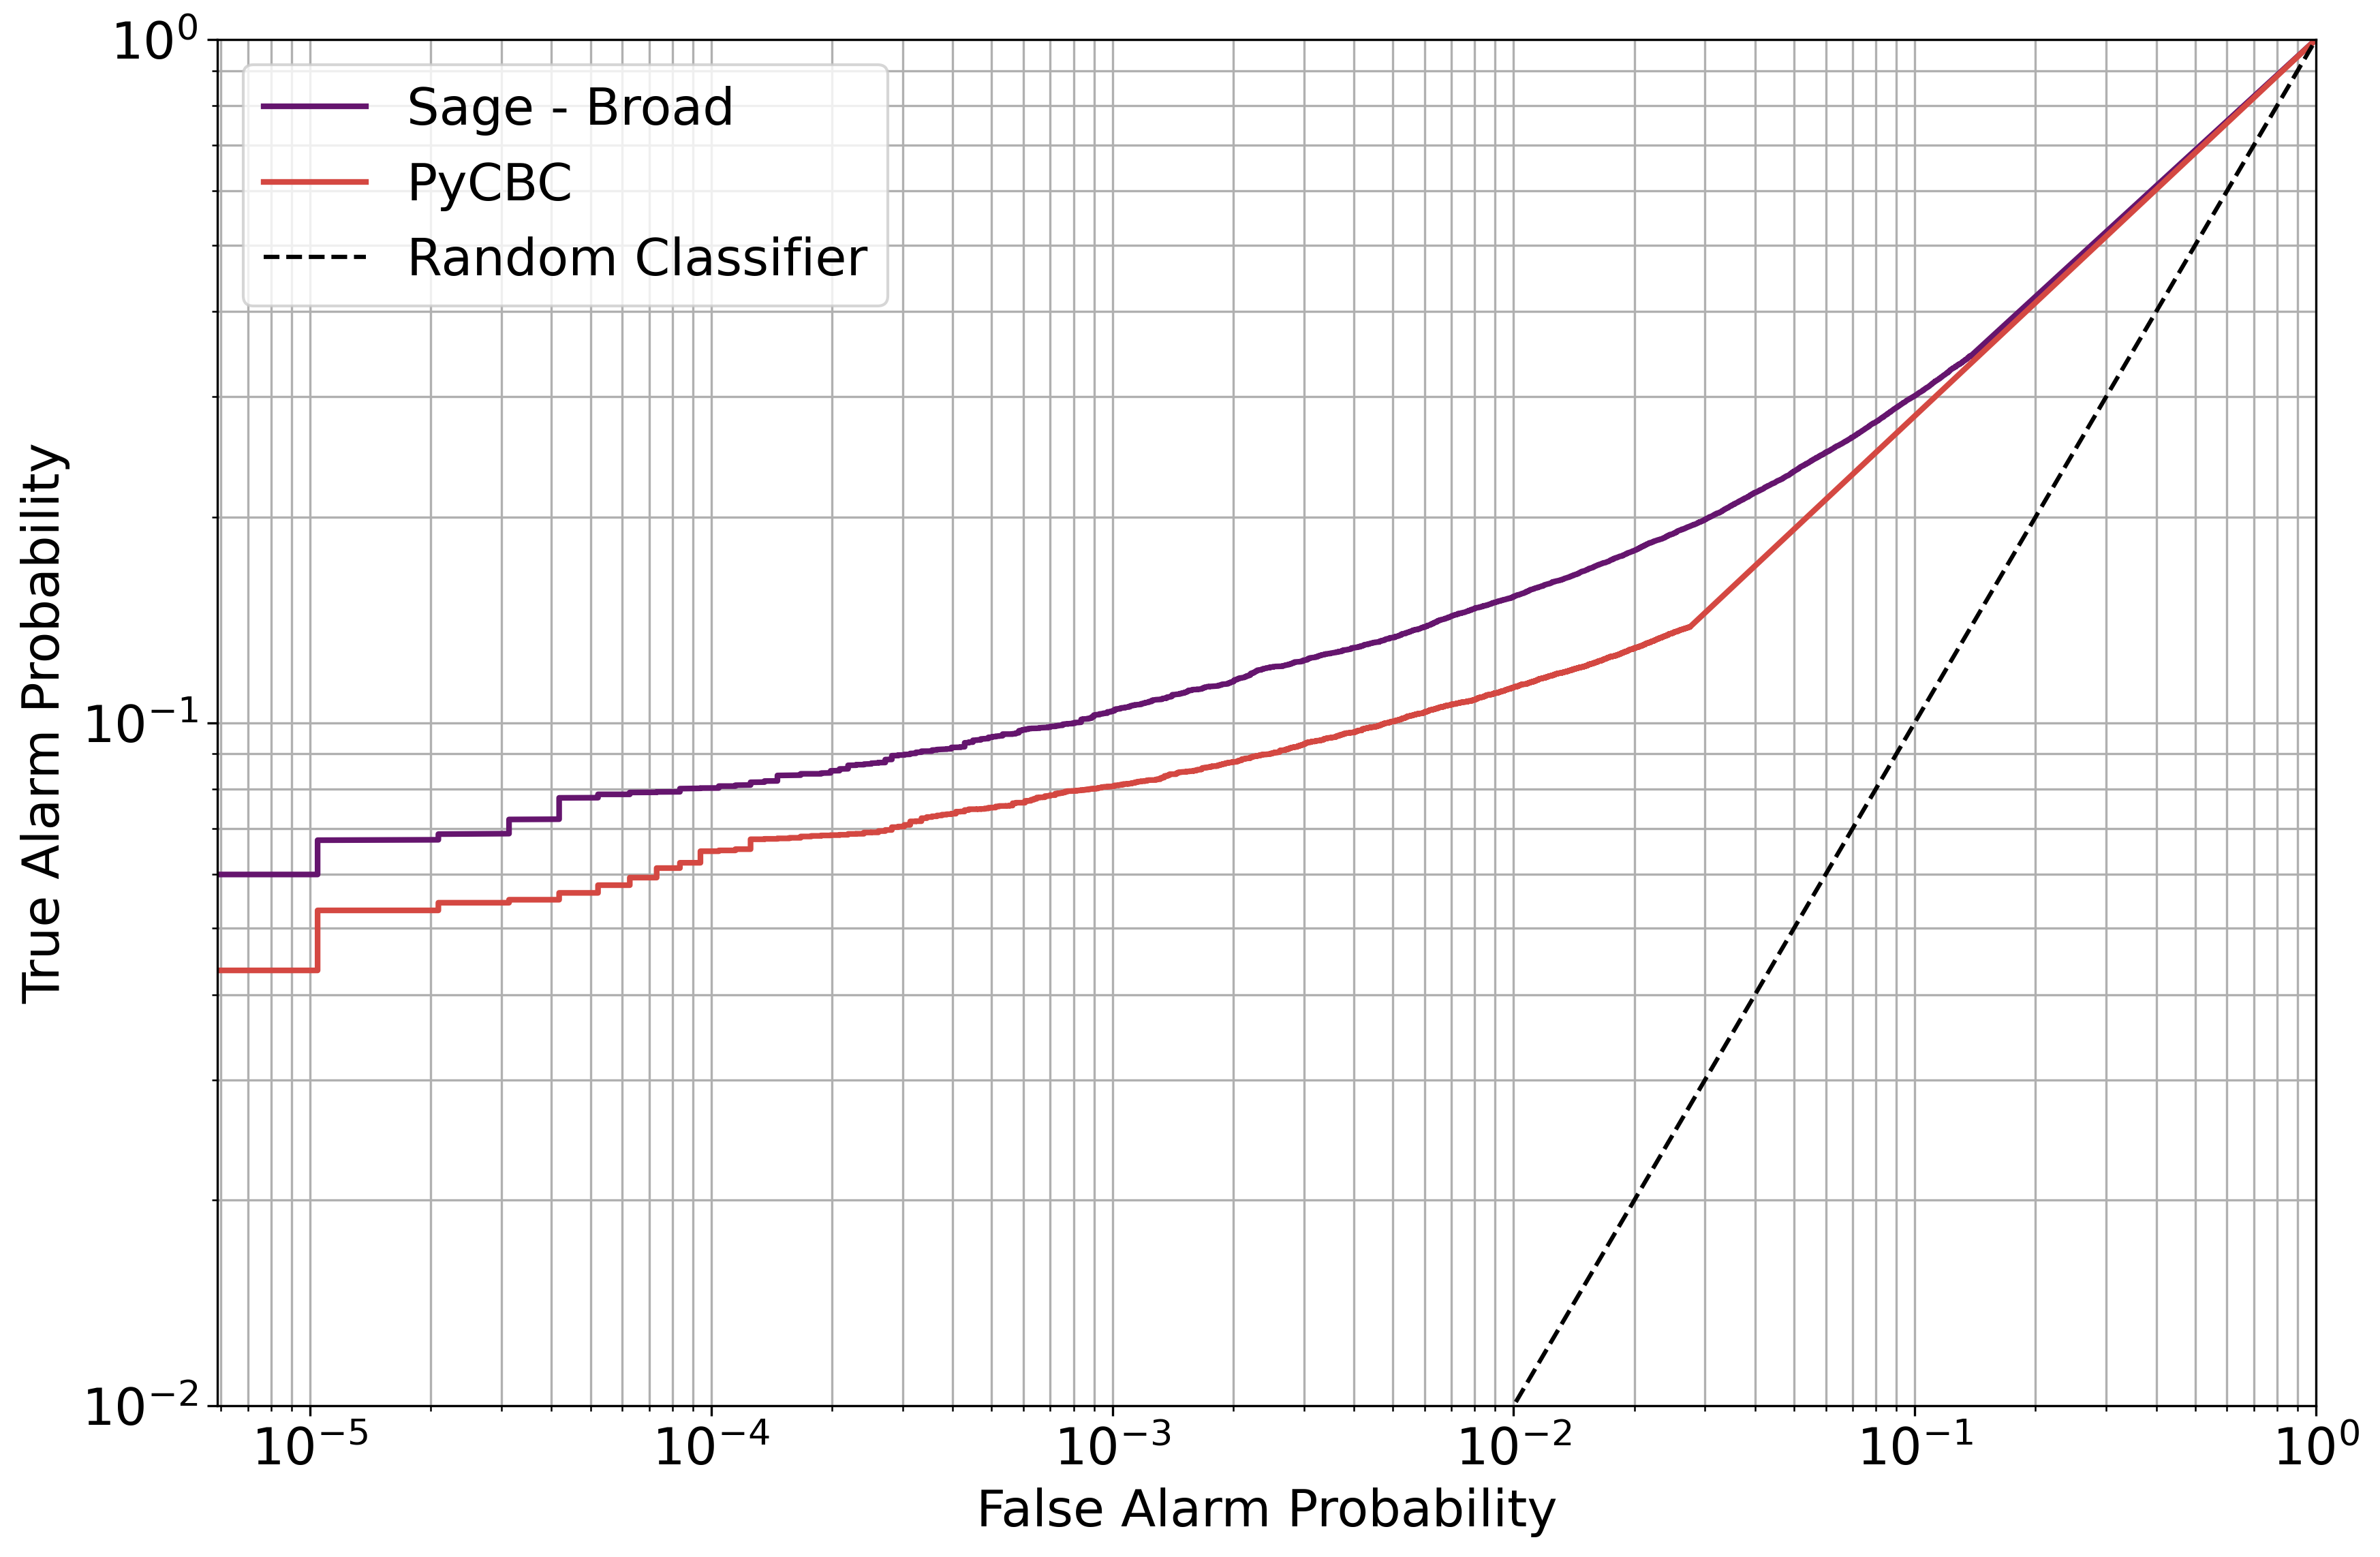
True alarm probability as a function of false alarm probability (ROC curves) for PyCBC and the Sage — Broad run that achieved the highest sensitive distance on the D4 testing dataset.
Per-parameter detection comparisons
The following hexbin plots show 1D and 2D histograms of detected signals at a false alarm rate of one per month, comparing Sage against each competing pipeline. The diagonal subplots contain 1D histograms of detected signals for individual parameters. Off-diagonal subplots are hexagonally binned, coloured by \(N^\mathrm{F}_\mathrm{Sage} - N^\mathrm{F}_\mathrm{other}\): black indicates no difference, progressively brighter red indicates more signals detected by Sage, and progressively brighter blue indicates more signals detected by the comparison pipeline.
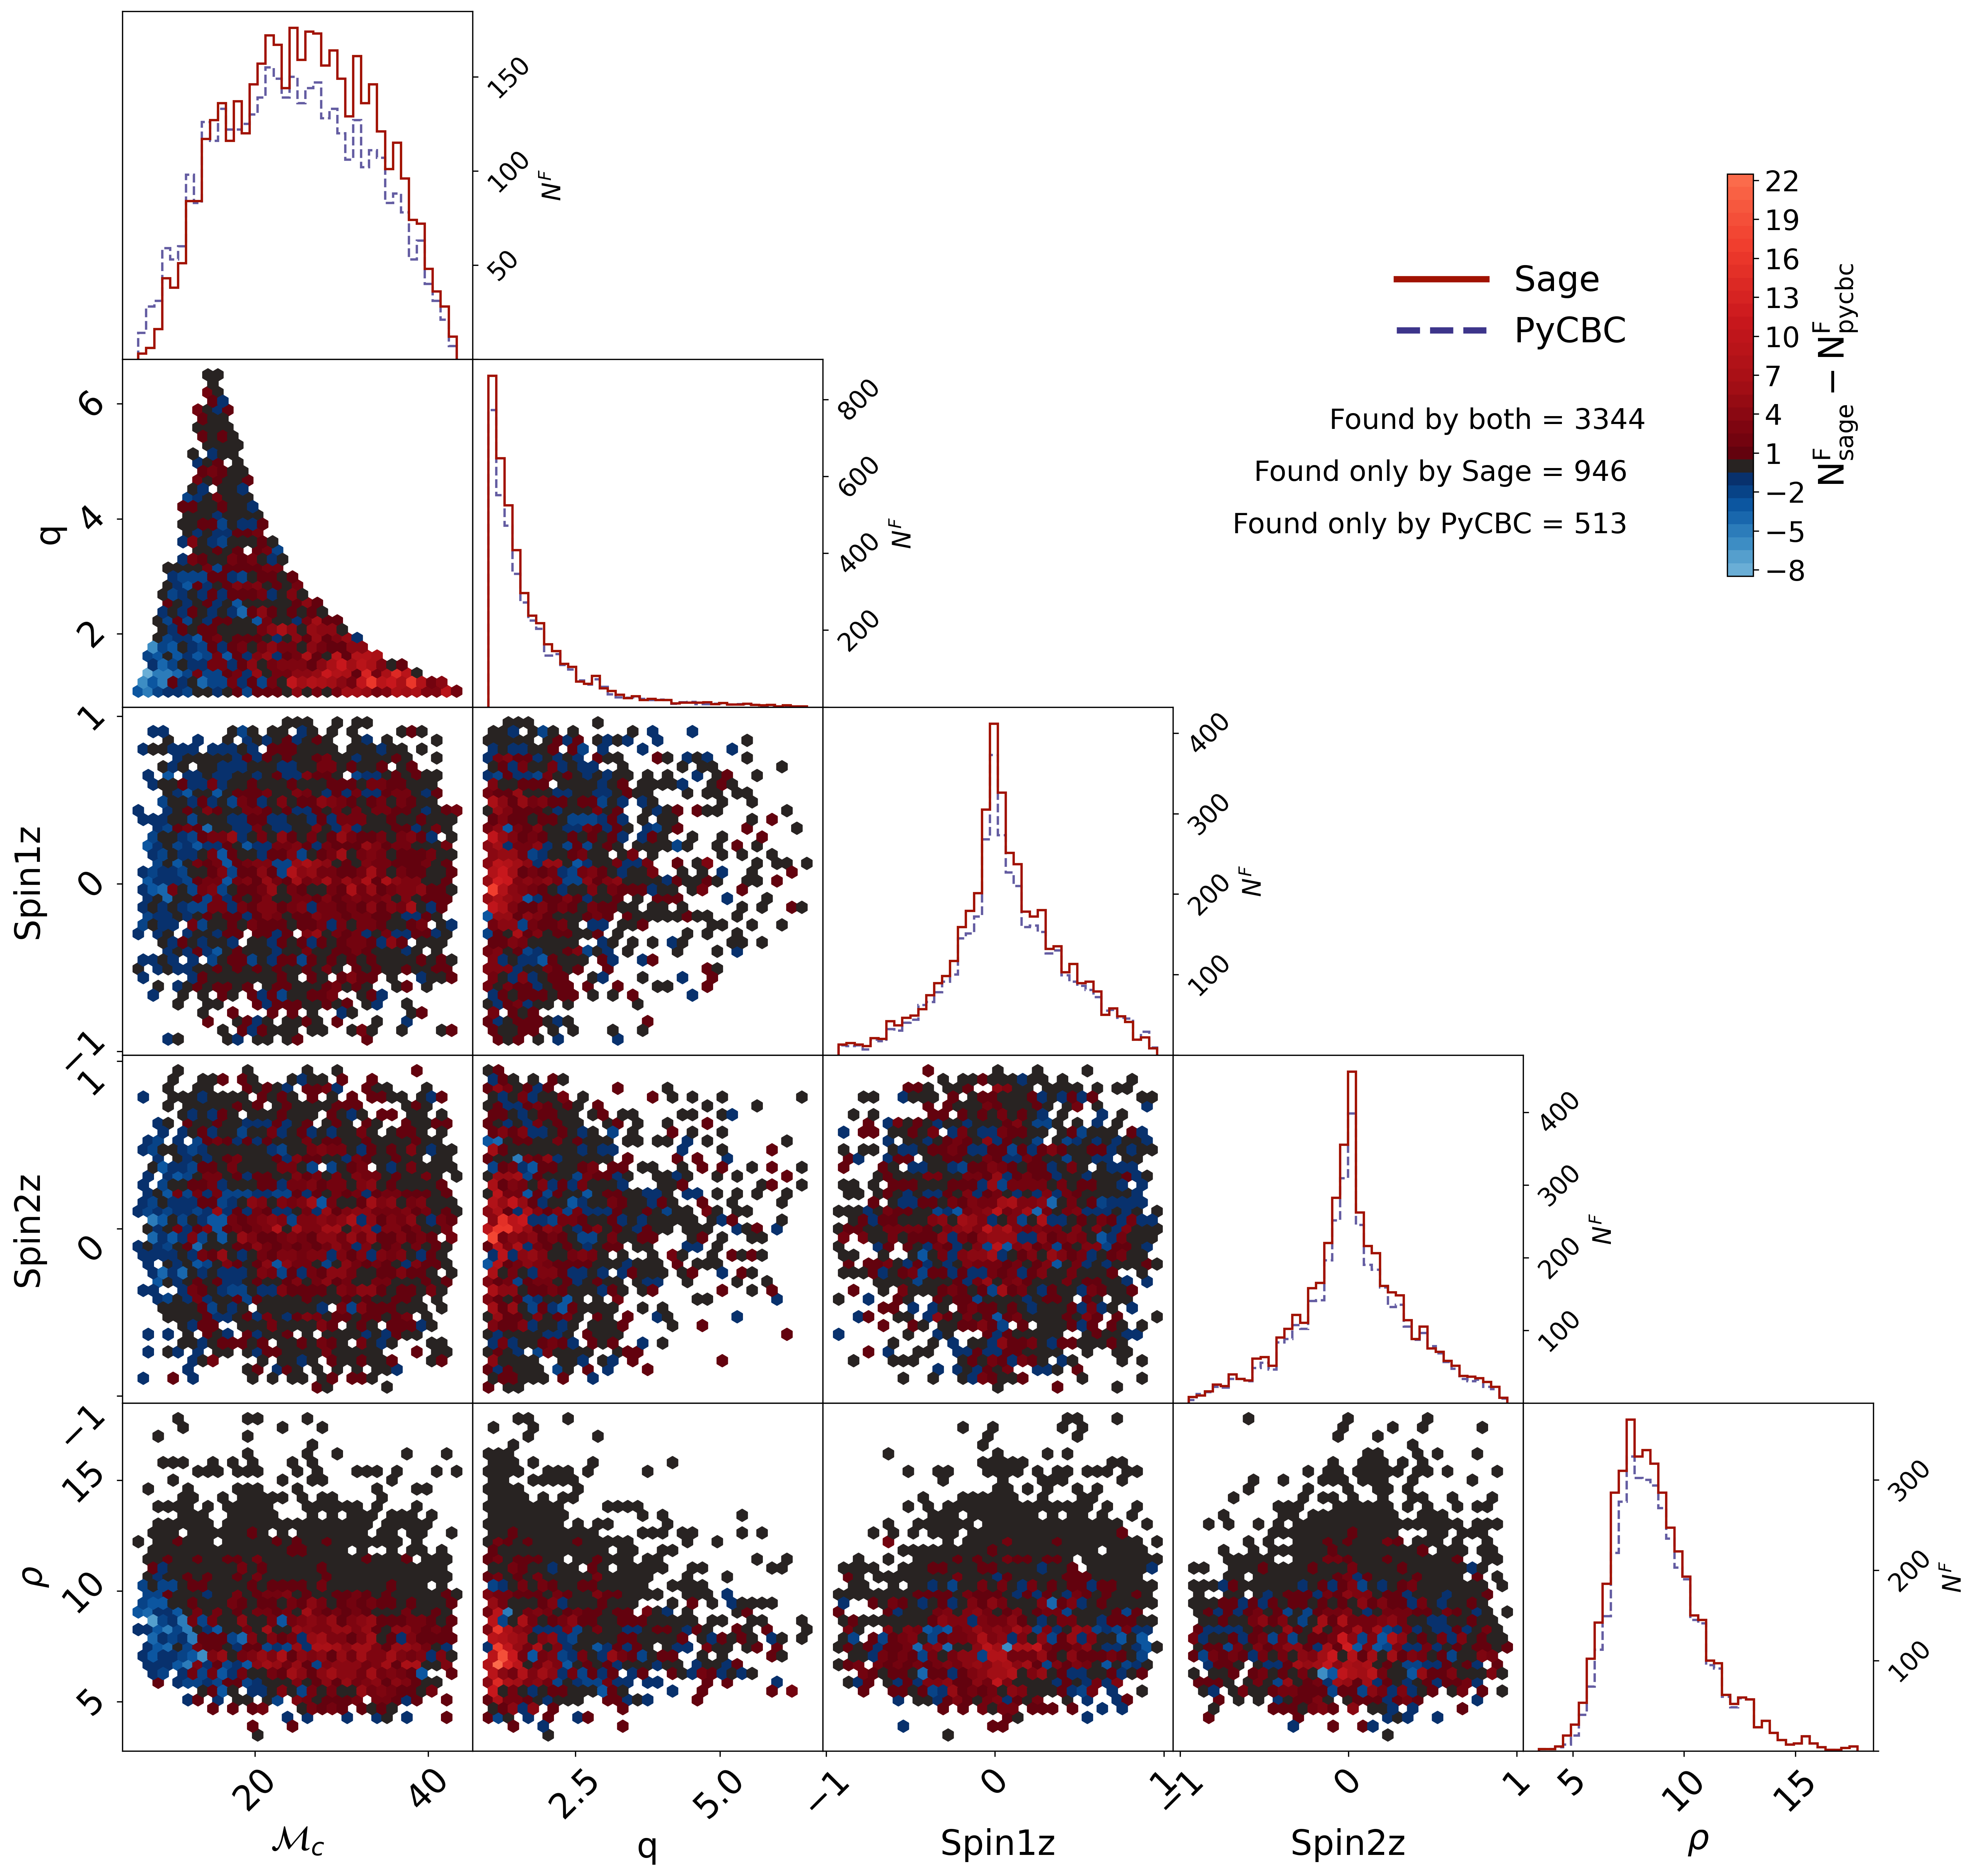
1D and 2D detection histograms at FAR = 1/month comparing Sage — Broad and PyCBC. Parameters were chosen where learning bias is expected to be visible. Red regions indicate parameter combinations where Sage detects more signals; blue regions where PyCBC detects more.
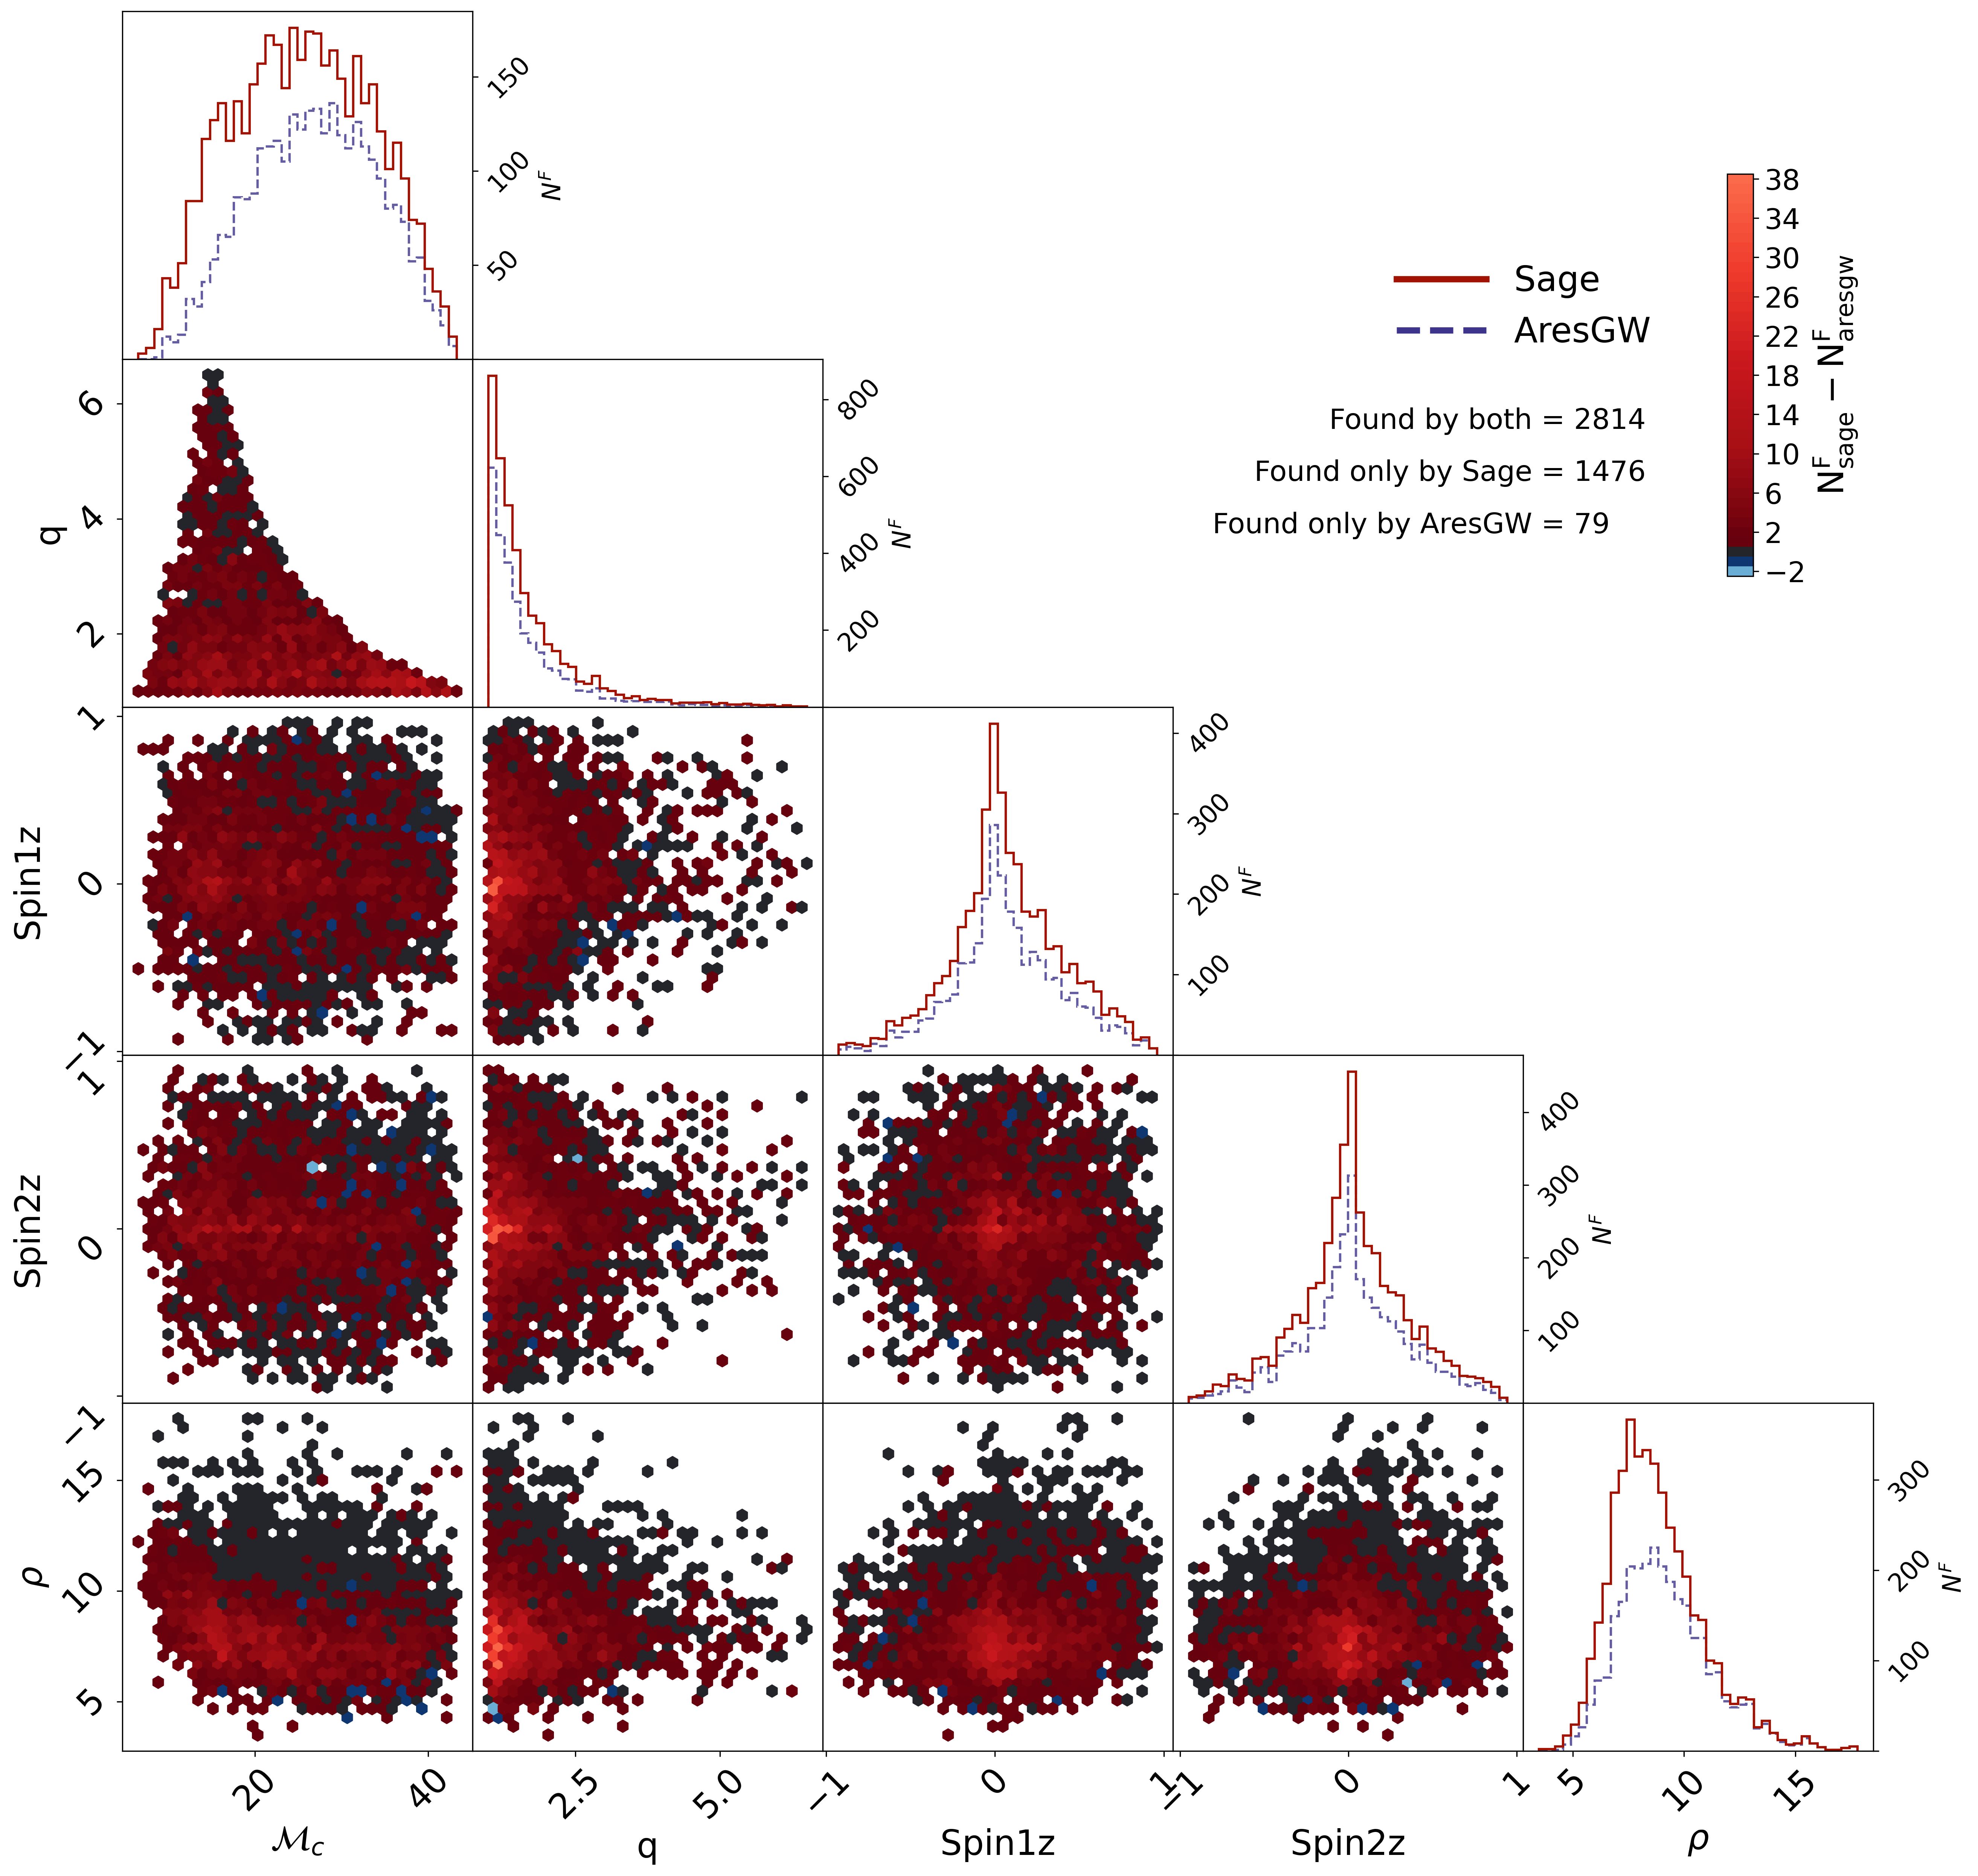
1D and 2D detection histograms at FAR = 1/month comparing Sage — Broad and AresGW (Nousi et al. 2023). Red regions indicate parameter combinations where Sage detects more signals; blue regions where AresGW detects more.
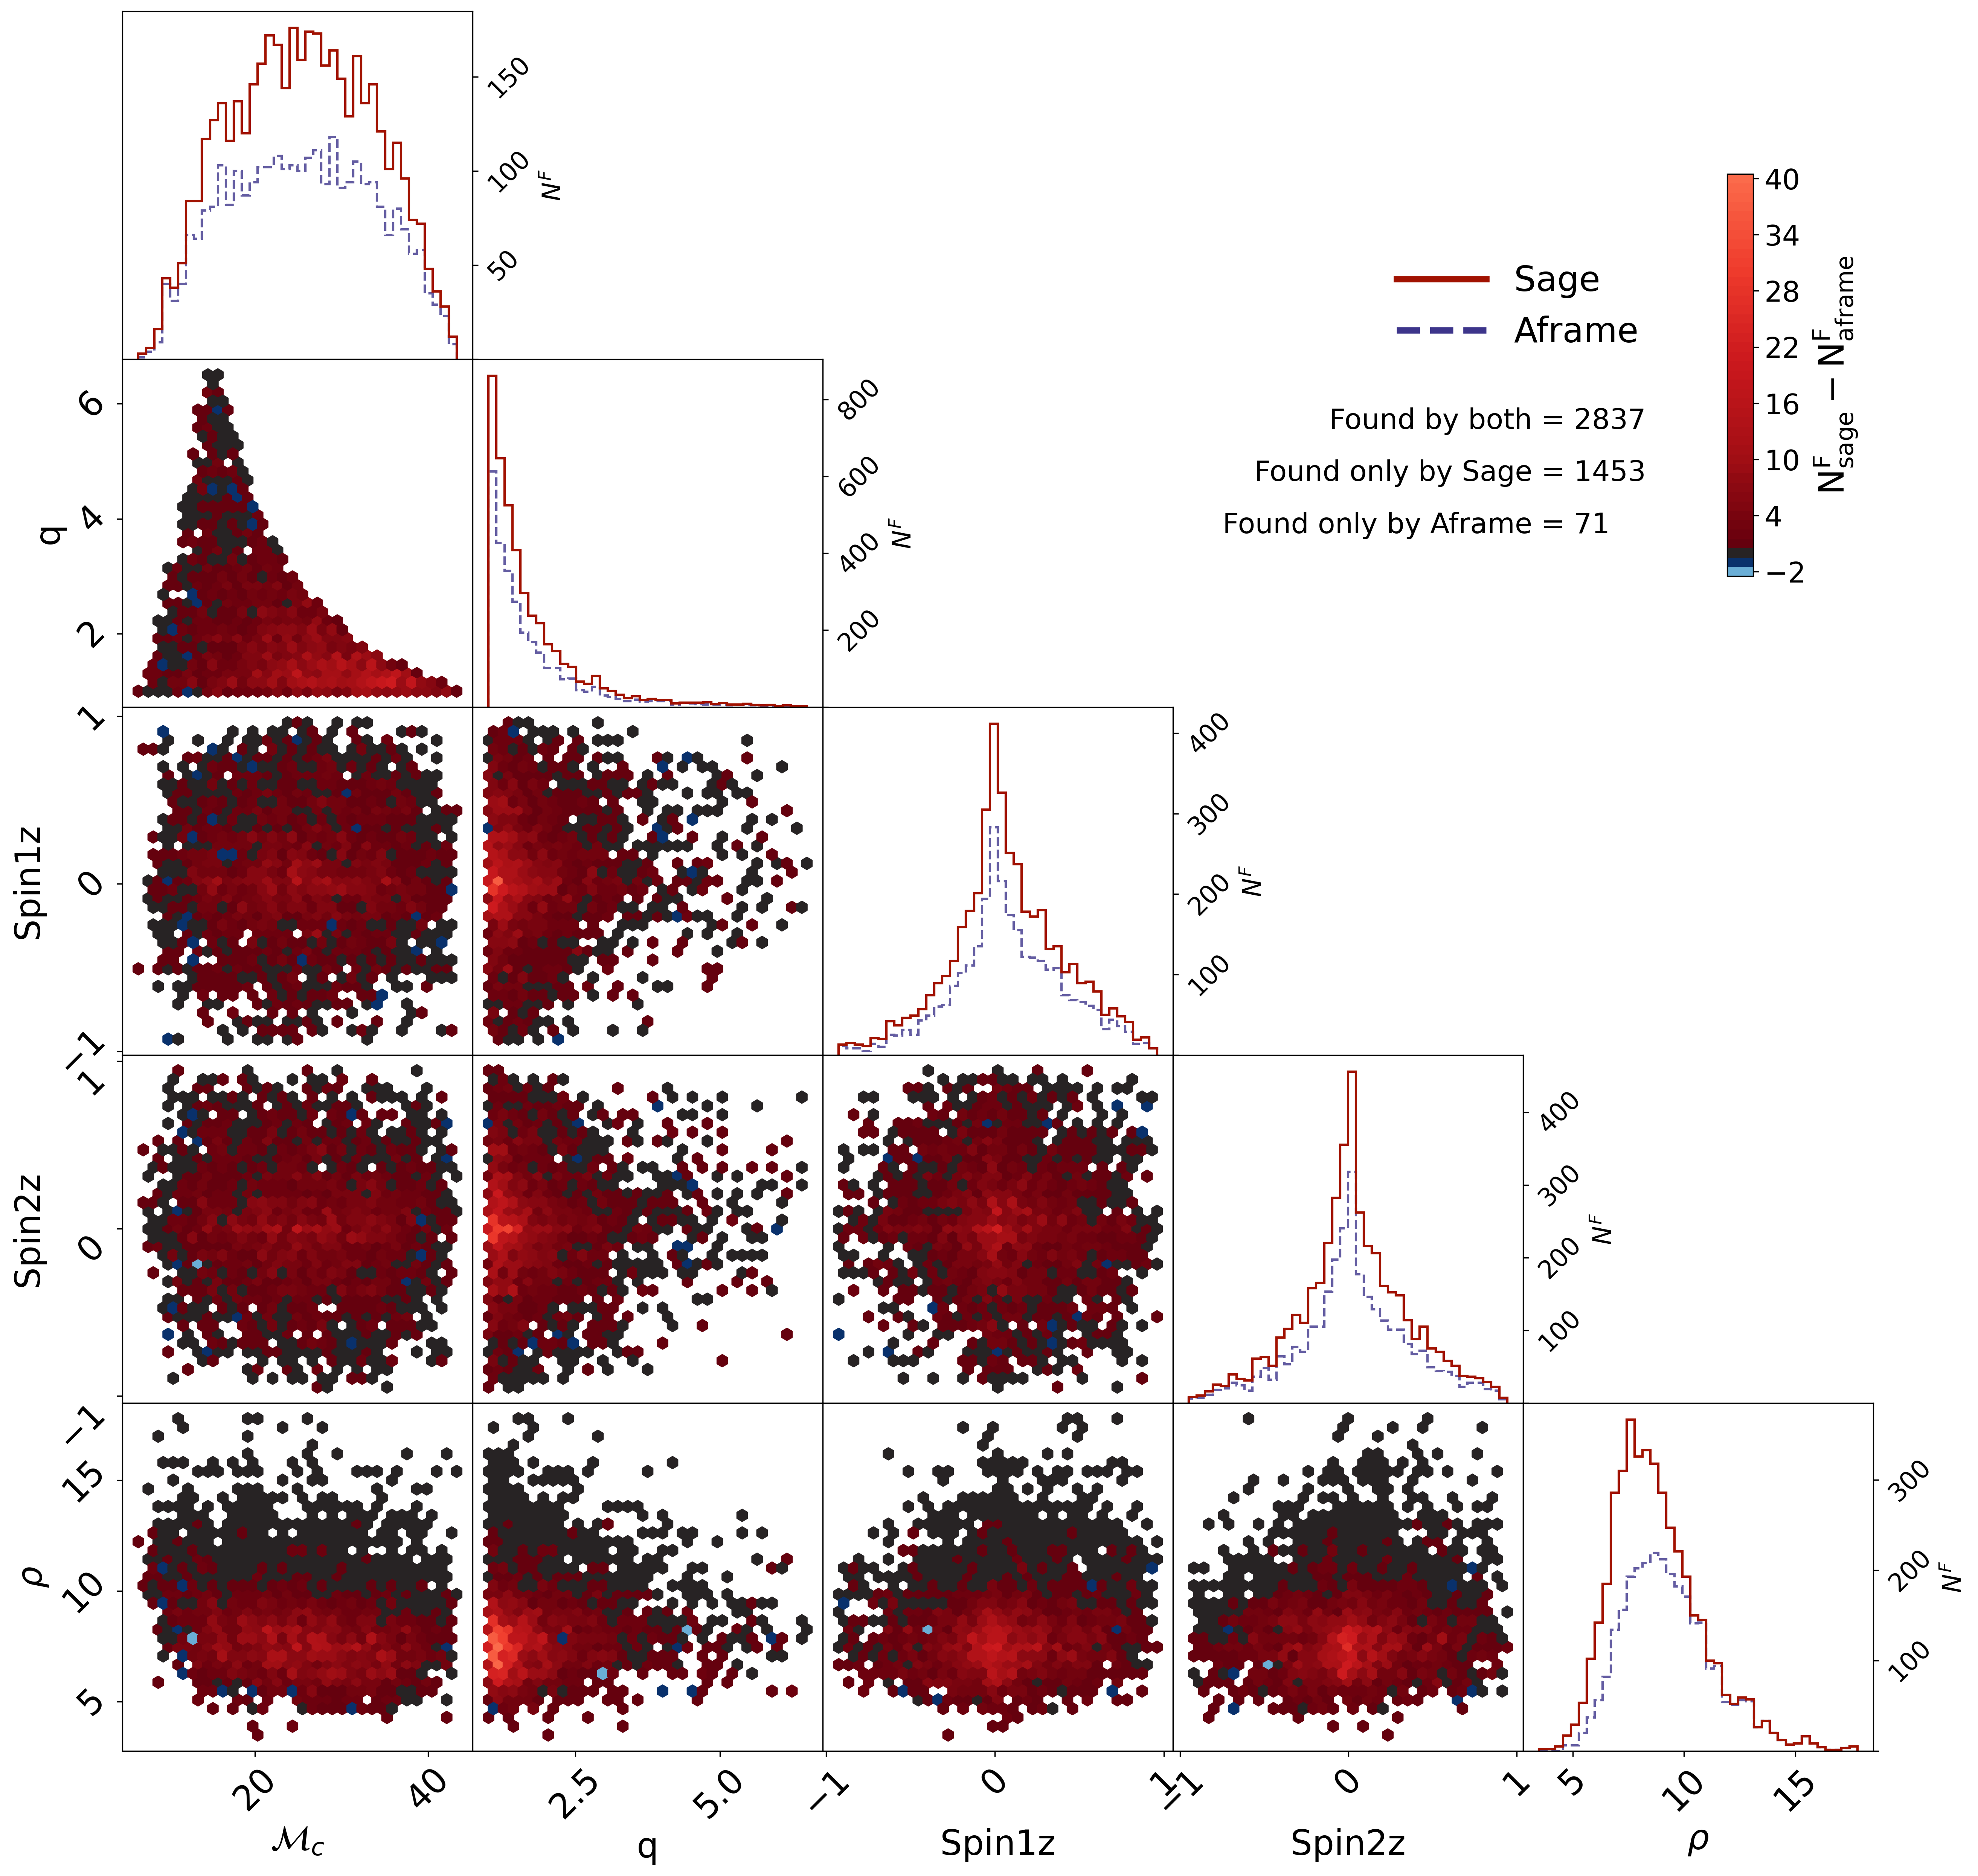
1D and 2D detection histograms at FAR = 1/month comparing Sage — Broad and Aframe. Red regions indicate parameter combinations where Sage detects more signals; blue regions where Aframe detects more.